Proteomics > Which service should I request? > Proteome Identification and Quantification > Phosphopeptide Quantification - Label-Free
Please note that most general considerations listed on this page also apply to label-based phospho-analyses. For additional information please consult our chemical labelling page.
Phosphorylated peptides are generally present at quite low abundance and, for this reason, they need to be enriched from complex mixtures. The most common phosphorylation sites are S/T/Y, and typical enrichment methods are:
Each sample is usually measured before and after phosphopeptide enrichment. With this approach, one can ensure that phospho-level changes reflect changes on the PTM level, and are not a consequence of changes in the proteome. Generally, we recommend running both analyses but leave it up to the customer to decide whether they are necessary in the context of the biological question.
Important considerations
Should both, proteome and phosphopeptide samples be analysed by LC-MS/MS, we integrate the two datasets in a single report.
Phosphopeptide Quantification - Label-Free (LFQ)
Table of contents
General description
The analysis of proteome-wide phosphorylation levels using MS1 intensities is similar to label-free protein quantification (see Proteome Quantification - Label-Free) with the addition of an enrichment step for phosphorylated peptides.Please note that most general considerations listed on this page also apply to label-based phospho-analyses. For additional information please consult our chemical labelling page.
Phosphorylated peptides are generally present at quite low abundance and, for this reason, they need to be enriched from complex mixtures. The most common phosphorylation sites are S/T/Y, and typical enrichment methods are:
- interaction with chelated metals (e.g. Ti-IMAC, Fe-IMAC) or covalent metal ions (e.g. TiO2) -> global enrichment of mostly pSer and pThr
- antibody-based -> enrichment of pTyr sites or site/motif-specific
- chromatography (HILIC, ERLIC, ion-exchange)
Each sample is usually measured before and after phosphopeptide enrichment. With this approach, one can ensure that phospho-level changes reflect changes on the PTM level, and are not a consequence of changes in the proteome. Generally, we recommend running both analyses but leave it up to the customer to decide whether they are necessary in the context of the biological question.
Workflow
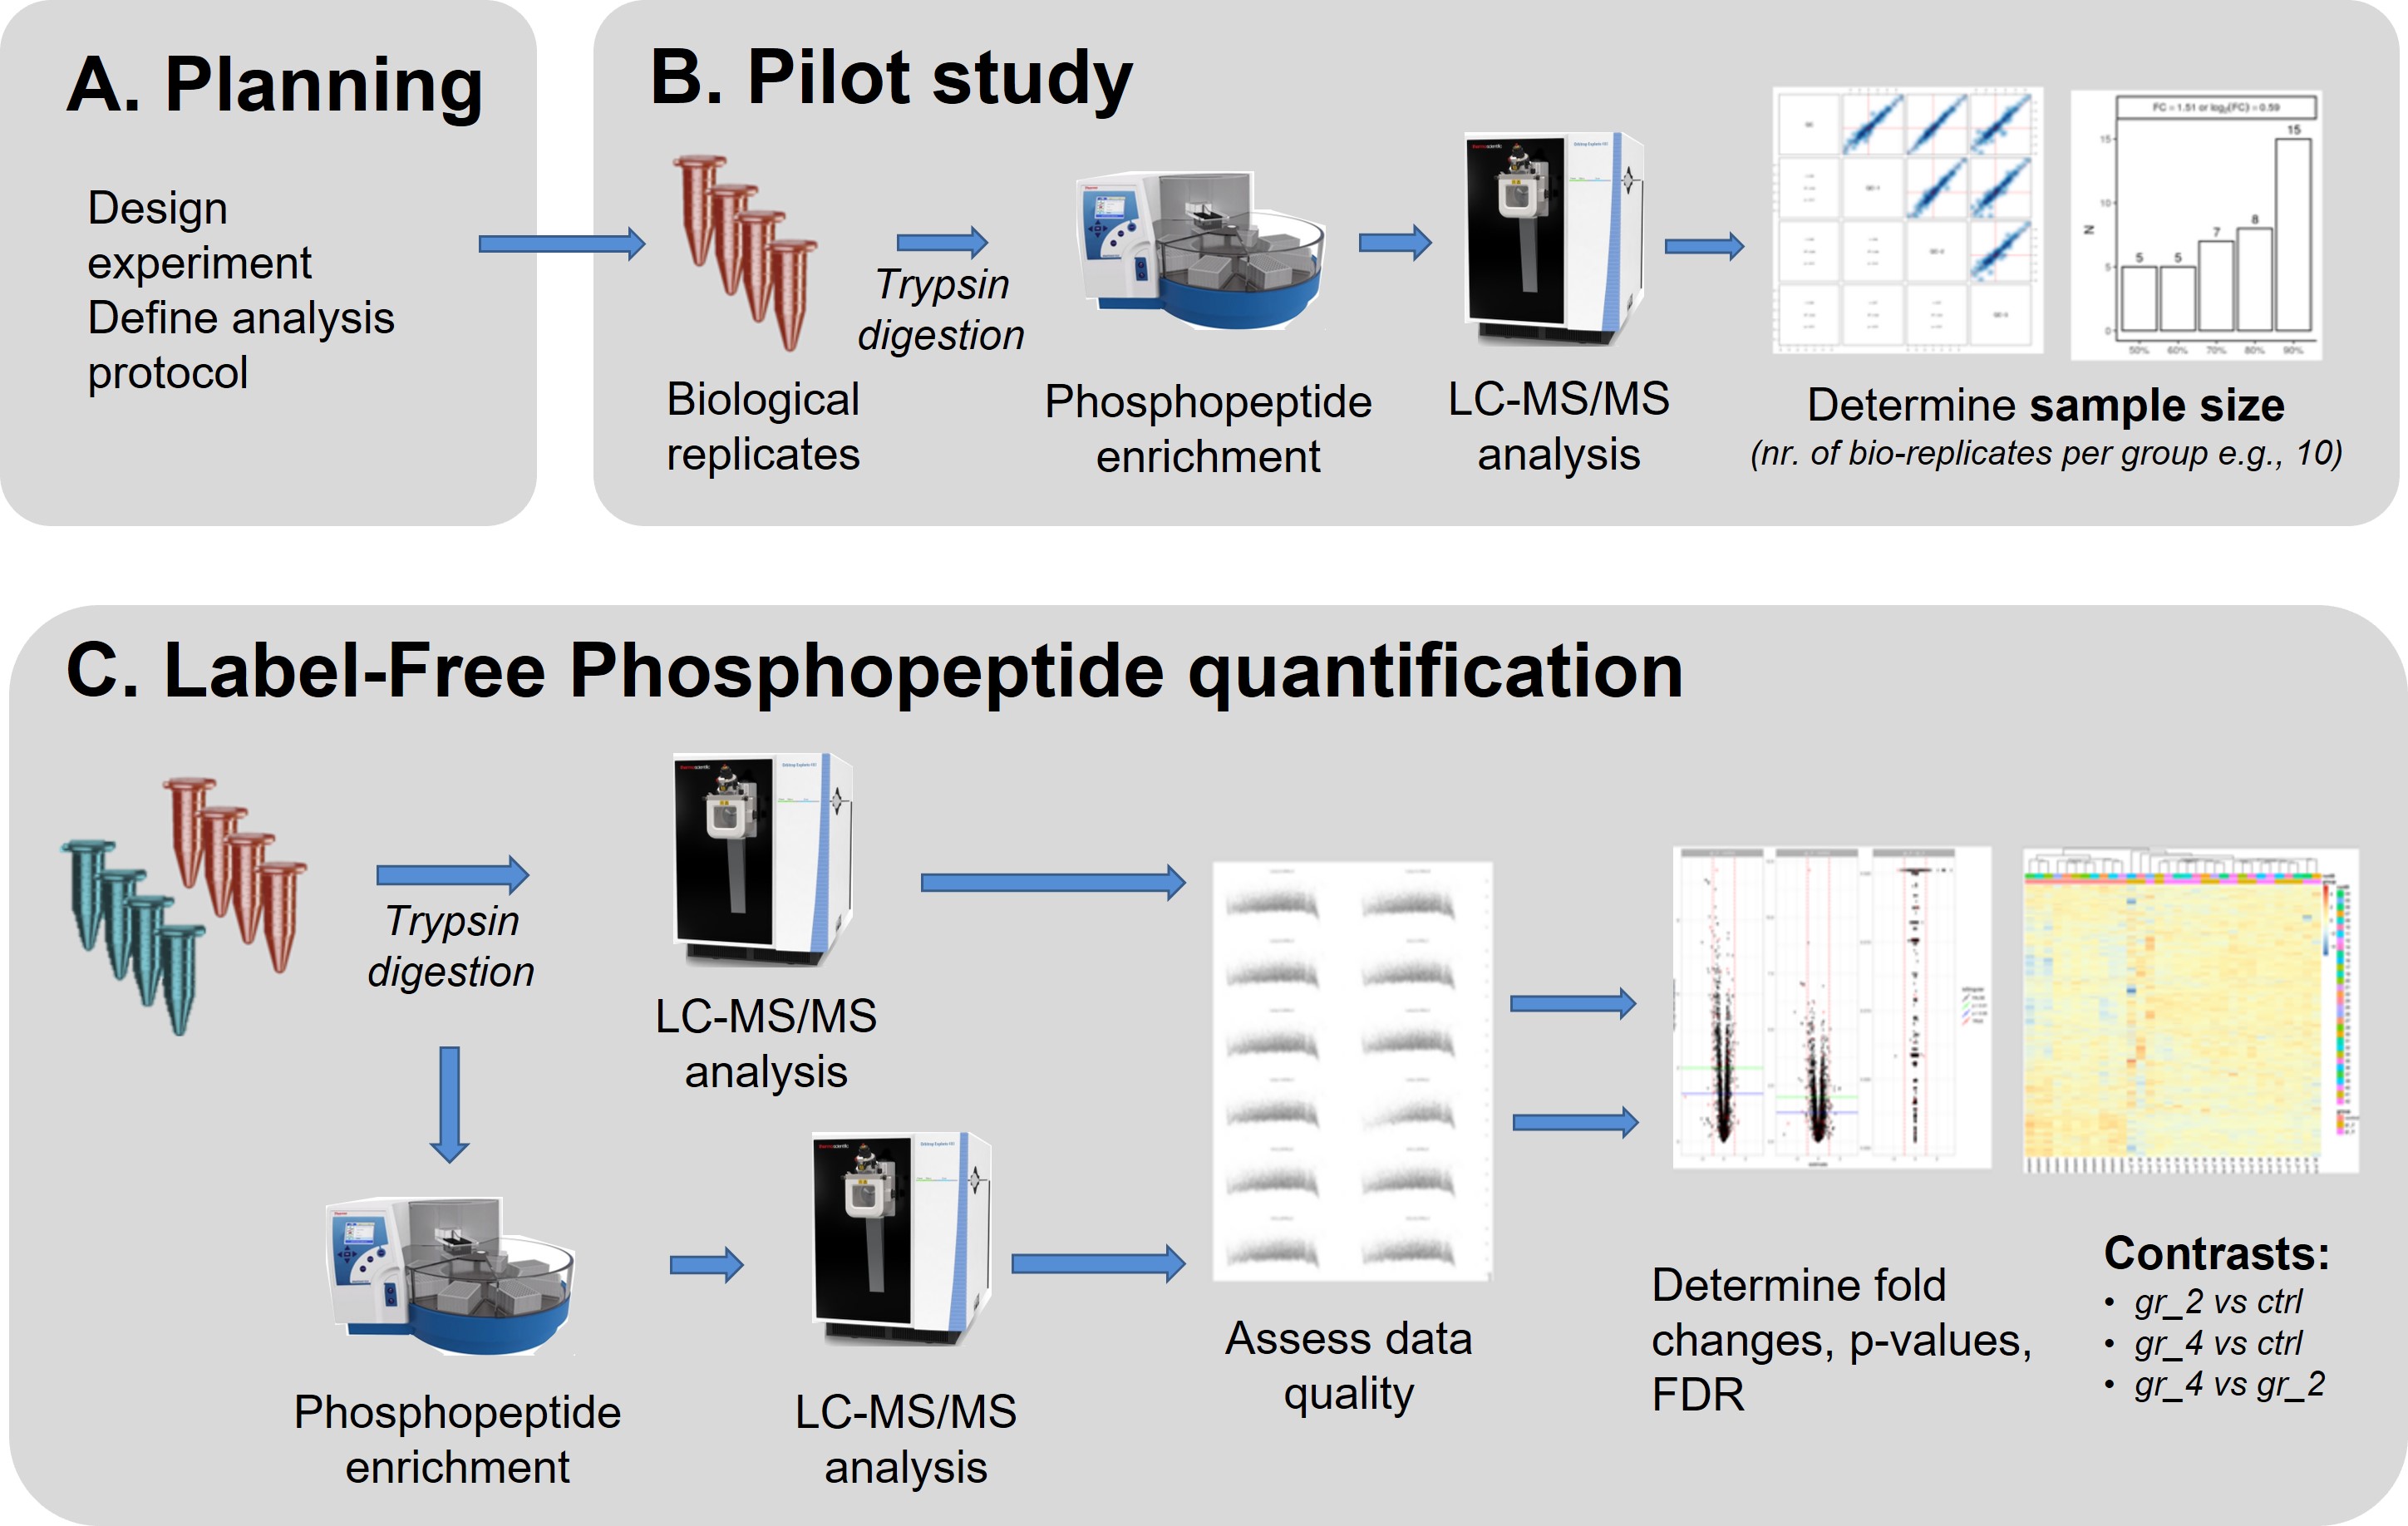
Our default workflow for label-free phosphopeptide quantification consists of 3 steps.
Planning
As a first step, we need to clarify the goal of the project and clarify the analytic and bioinformatics strategy. A proper experimental design will be defined together with FGCZ staff. Please contact us at proteomics at fgcz.ethz.ch for a meeting, or directly contact your coach If you already have a B-Fabric project at FGCZ.Pilot (QC) step
Aim- Assess appropriate experimental procedure (sample processing protocol, starting amount and quality of the samples)
- Gauge analytical depth
- Estimate variance of replicates
- Ensure the correct enrichment strategy is used
- Power estimation
Important considerations
- Phosphorylation dynamics range from seconds to hours/days
- Ensure that the samples are submitted under conditions that preserve the phosphorylation status (e.g. snap freezing, cold washes, phosphatase inhibitors, denaturing buffers)
- Minimize time at temperatures where enzymatic activity of e.g. proteases, phosphatases and kinases is still possible
- Depending on the type and origin of your sample (e.g. tissue, cell extract, supernatant) as well as organism, we observe some dozens up to a few thousands of phosphopeptides and proteins
- Ensure that you understand what analytical depth is required and the data's usefulness to answer your biological question
- Does your system require defined stimulants for sites of interest to be phosphorylated?
- Do you need to remove/reduce cell culture additives such as FBS?
- Phosphorylation is usually a low abundance event
- The lower the phospho-peptide stoichiometry in the sample the more difficult it is to see that site even in the enriched fractions
- Especially pTyr sites are difficult to detect (usually make up <1% of total phospho pool) and may need to be specifically enriched
- While the overall number of identified phospho-peptides/proteins can highly vary depending on the biological context, it is crucial that the same peptides and sites are reproducibly identified in your replicates
- While match-between-run algorithms allow for the transfer of chromatographic features of identified peptides to reduce missingness in the quantification matrix, it does not allow proper site localization scoring. Especially in the context of peptides with multiple potential phospho sites this creates uncertainties.
- In addition, the pilot step helps us determine the number of replicates necessary to detect the protein fold-change (effect size) that is relevant for your assay. In general, smaller biologically significant effect sizes require more samples to obtain a statistically significant result. For this analysis we require four biological replicates for proper variance estimation.
Label Free Phosphopeptide Quantification step (LFQ)
The main experiment is performed following the protocol tested and optimized during the QC step. A minimum of 3 replicates per condition for samples from in vitro studies (e.g. cell culture) are required for meaningful statistical analyses. In vivo experiments strongly benefit from larger replicate numbers. Sample processing is largely automated with protein digestion, peptide clean-up and phospho-peptide enrichment all performed using automated assays which allow for the processing of up to 96 samples in parallel.Should both, proteome and phosphopeptide samples be analysed by LC-MS/MS, we integrate the two datasets in a single report.
Requirements and additional considerations
- The first QC step is mandatory. Do not prepare the samples for the main LFQ until these results are available.
- Ideal protein amount: 200 µg - 1 mg
- If input material is limited (10-50 µg/condition) we recommend a chemical labeling and multiplex approach
- Replicates: 3+ for in-vitro experiments, 5+ for animal/human experiments (depending on the results of the sample size estimation)
- If higher analytical depth is required we recommend using a chemical labeling and multiplex approach followed by sample fractionation
- High-pH offline fractionation has been shown to be superior to alternative fractionation strategies (e.g. SCX) in terms of phospho-peptide identifications
Sample preparation
- We recommend denaturing conditions and an SP3-based method for protein digestion and clean-up BUT without the use of protease or phosphatase inhibitors which cannot be efficiently removed during clean-up
- Alternative digestion protocols can be used (FASP, on-bead) but have limited throughput capability
- PCT-based approaches and extended periods of high temperatures have detrimental effects on phosphorylation
Turnaround time
- QC (Pilot) step: 1-2 weeks
- Main label-free quantification or multiplexed experiment (3-4 weeks)
Data acquisition and data analysis
- The enriched samples and the whole proteome samples are usually measured separately but randomized in between groups
- iRT peptides spiked in the samples (Biognosys - QC and RT alignment purposes)
- QC sample every 4-5 runs
- The data can be acquired and analysed in multiple ways, but these are the 2 most common strategies used at FGCZ:
Data-independent acquisition (DIA) mode
- Data are acquired on a latest generation Orbitrap instrument such as Thermo Exploris 480 using optimized window settings
- MS2 feature extraction and quantification is done using
- Spectronaut (library-free or library-based)
- DIA-NN
Data-dependent acquisition (DDA) mode
- Data acquisition on M-Class + Orbitrap Fusion Lumos (or similar generation, see here)
- Protein/peptide identification and signal extraction for quantification
Further Data Analysis and Statistical Evaluation
- Data analysis and group comparisons on peptide level is done using linear or mixed effect models using our published prolfqua
- If enriched and whole proteome samples are measured, the resulting comparisons are integrated and visualized accordingly
- Generation of reports, tables and plots
- for selected species, e.g. human and mouse, Gene Set Enrichment Analysis (GSEA) and Over-Representation Analysis (ORA) are performed using our fgcz.gsea.ora package, which integrates WebGestalt
Assessment of the LC-MS performances
The performances of the LC-MS instruments are constantly monitored using 3 different pipelines (PanoramaWeb; QCloud; internal FGCZ tool(s)), and 2 sets of standards:- autoQC4L:
- 25 ng of digested proteins from K652 cells + 6x5 LCMSMS Peptide Reference Mix (Promega)
- at the start and end of a queue, to assess identification and quantification rates
- autoQC01:
- 10 peptides from commercial digested BSA (25 fmol) and 11 iRT peptides
- PRM acquisition - acquired every 4-6 samples to monitor potential drops in sensitivity.