Untargeted Metabolomics
Table of contents
Background
- Untargeted metabolomics aims at the detection and relative quantification of polar and charged metabolites and related chemical classes. This covers metabolites involved in glycolysis, TCA, amino acid metabolism, nucleotide metabolism and related pathways.
- Although all considerations are taken to perform an unbiased analysis, this does not mean that all chemical classes or every metabolite in all pathways are covered. An example coverage data set for specific sample types (matrices) is attached below.
- It is important to consider that "untargeted" does not mean question-free experiments. Knowledge will not emerge from the mere collection of lot of data without clear questions defined apriori. Data torture after analysis performed to extract any knowledge without a pre-defined research question will mostly lead to findings confirming inherent biases and will mislead the interpretation. Therefore, it is crucial to spend the necessary time to reflect on the research question and how metabolomics will help answer it as this will be the topic of our first meeting.
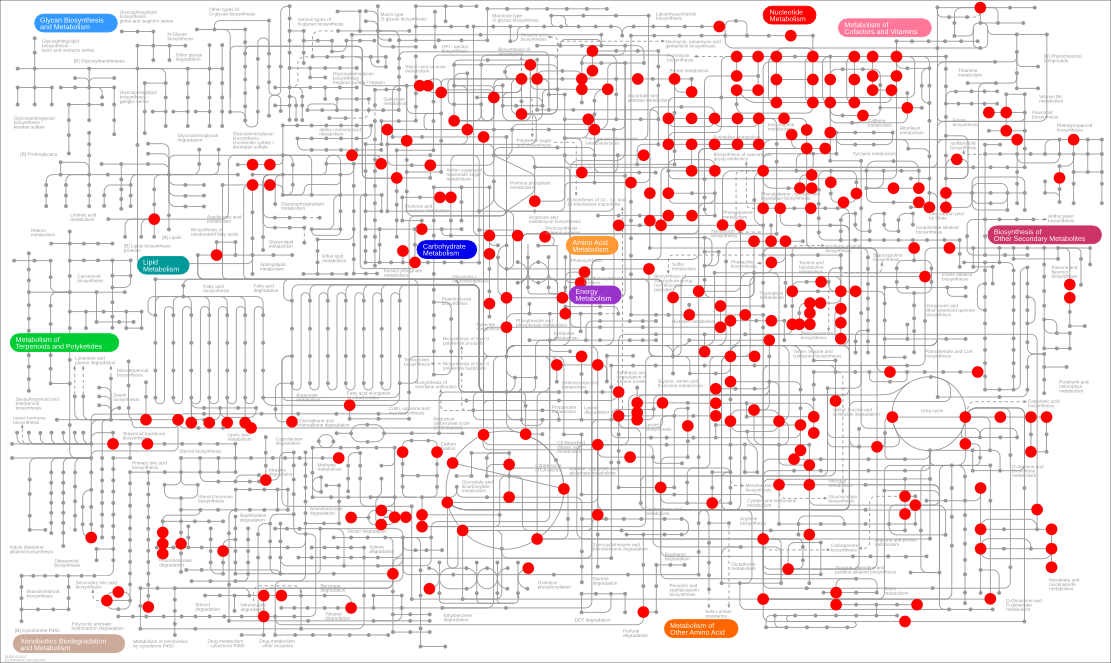
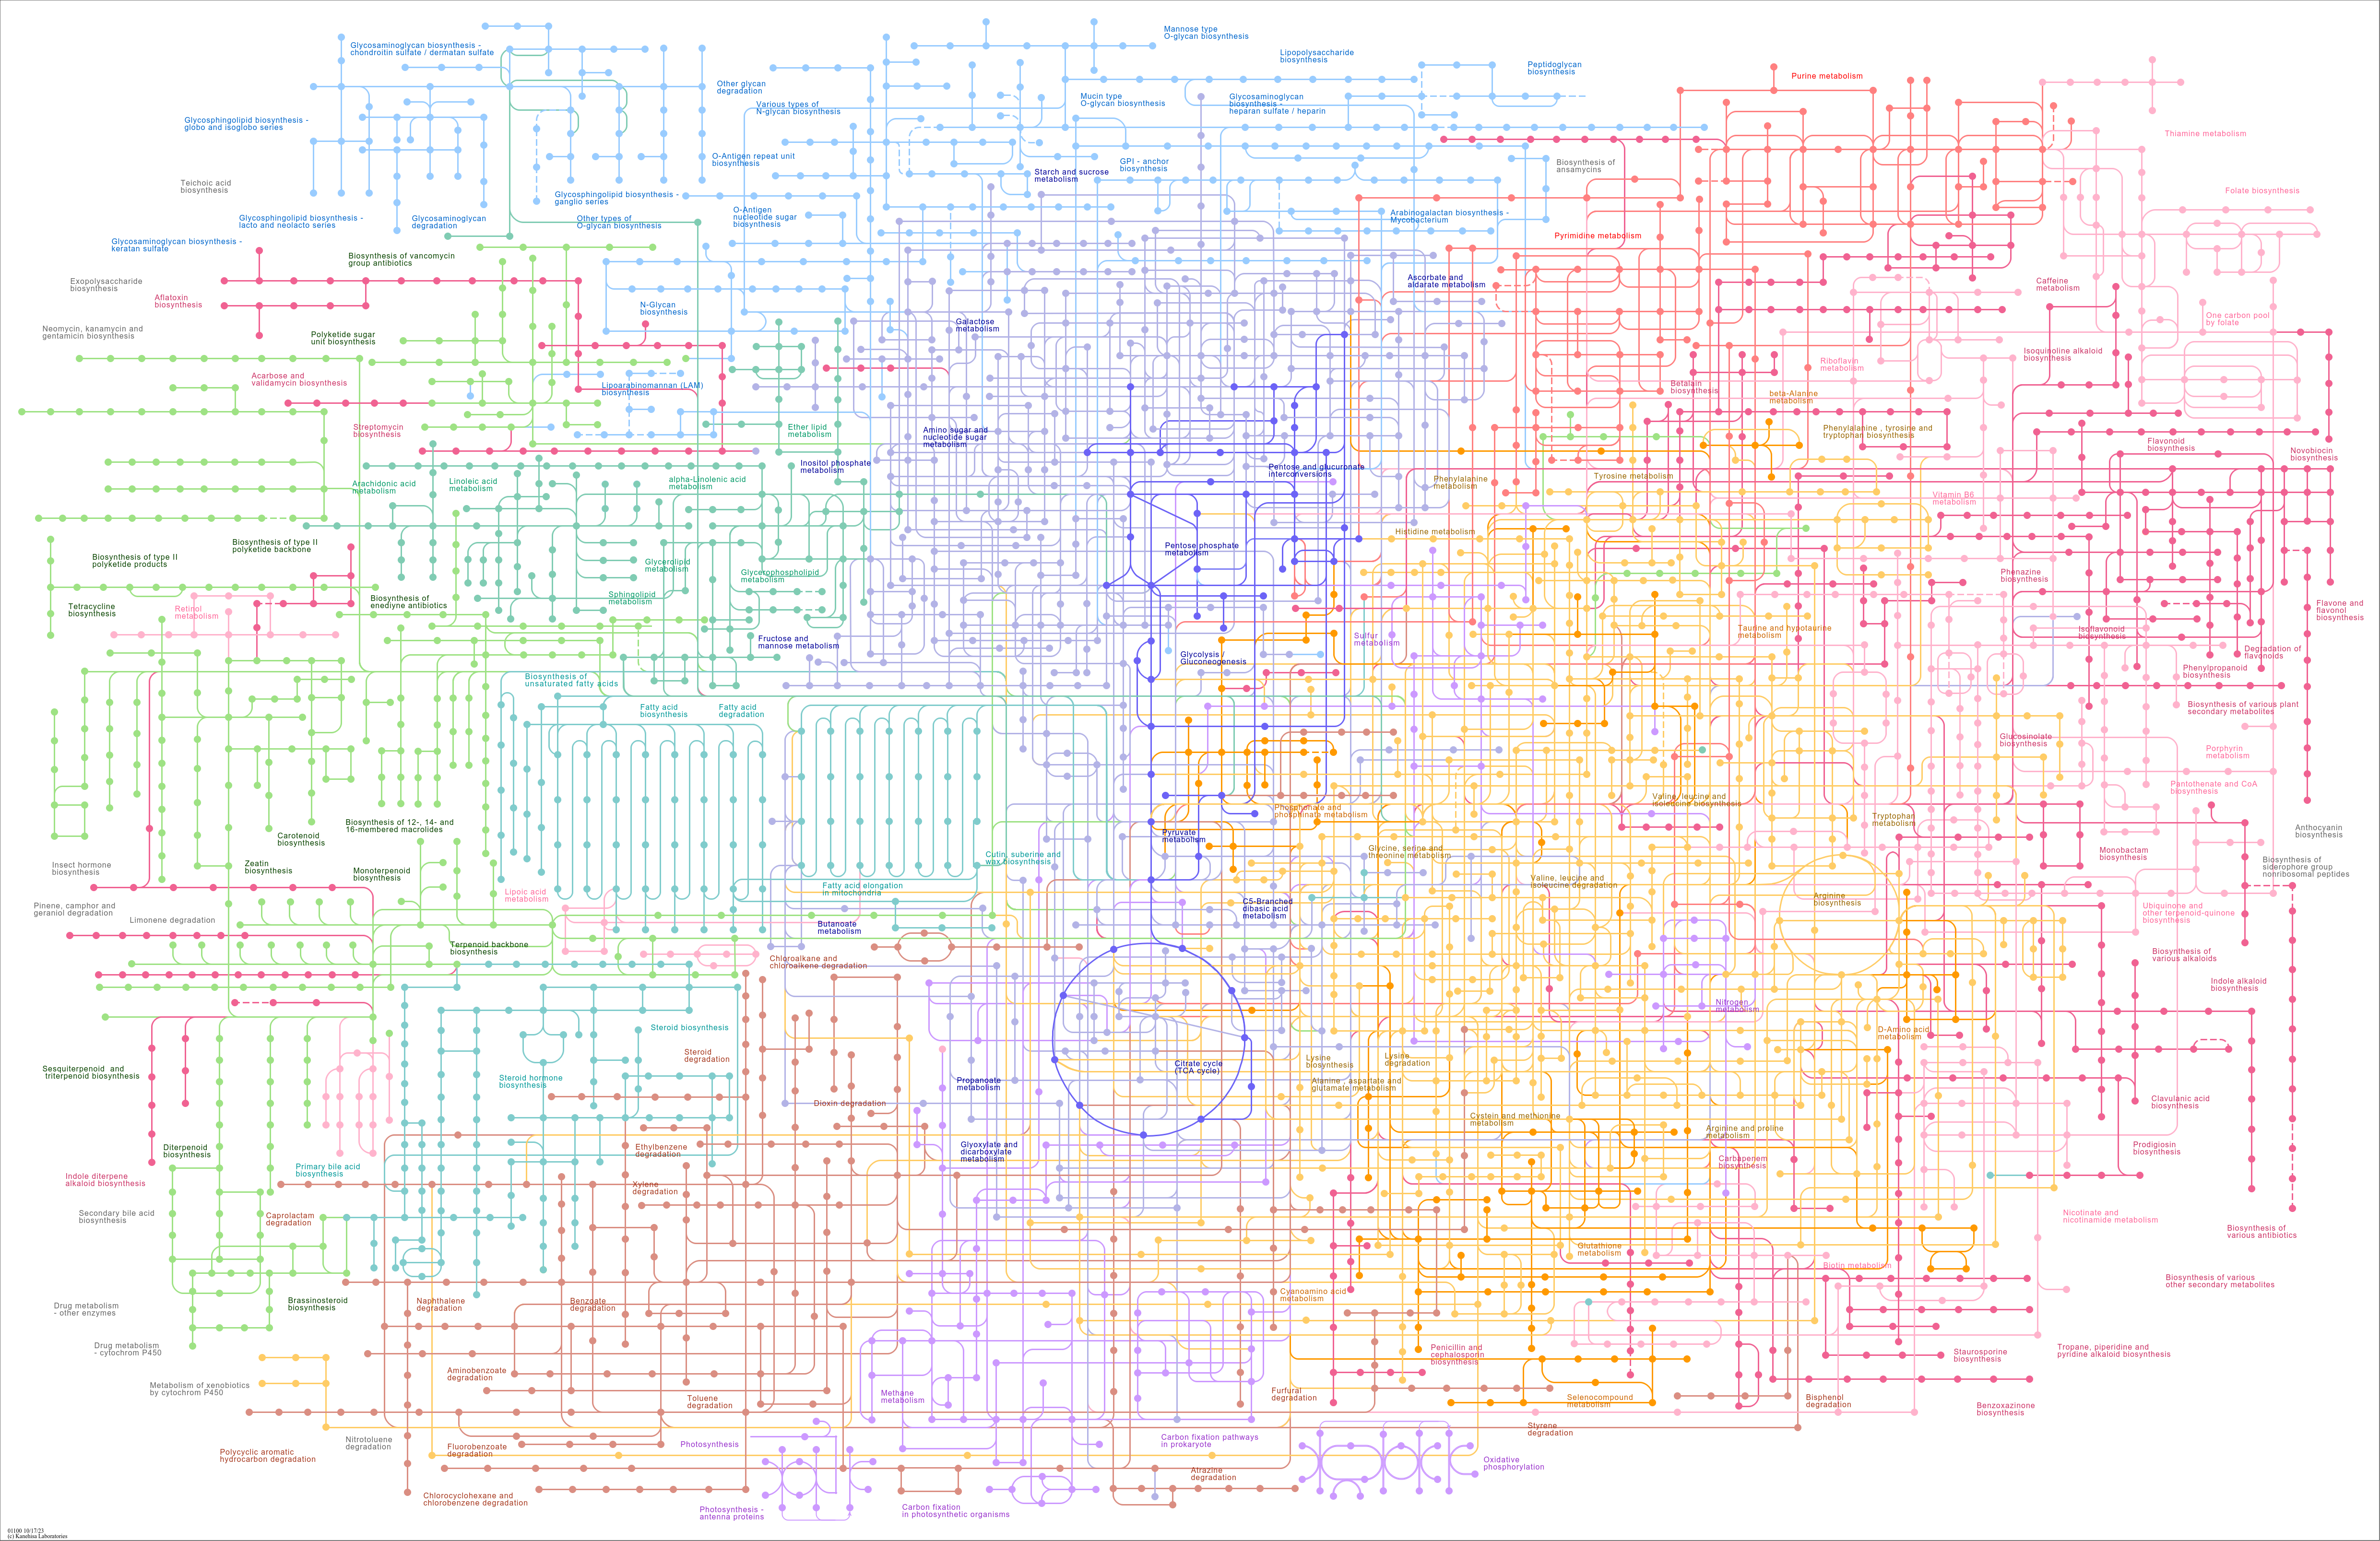
- An Overview of Metabolic Networks (KEGG Map)
- Workflow :
- Study Design: It is important to consider a design that allows to answer the research question based on our current best knowledge. Check the literature, formulate a clear research question, try to mentally simulate the best (and worst) possible outcomes.
- Sample Collection: As metabolism is very fast and continuous process, extra care should be taken to stop metabolism (quenching) once the system is out of its natural state. Different protocols for quenching exist depending on the system under study.
- Sample Preparation: As described below, this is usually done in our labs at FGCZ.
- LC/MS measurement: several analytical workflows exist to cover deferent chemical classes as described below in detail
- Data Analysis: This entails the analysis of raw mass spectrometry files for peak picking, alignment, normalization etc. as described below.
- Interpretation: This steps answers the research question through the acquired metabolomics datasets and ensuing analysis.
- New questions with new study design: As the process is iterative, usually successful experiments will lead to more targeted questions and hypotheses that can be refined by following the same workflow or performing targeted LC-MS.
- References
Sample Preparation
Tissue Homogenization
- For solid tissues, homogenization is necessary before extraction. There are several protocols depending on the tissue and the stability of the metabolites. We use TissueLyser with bead beating as the default homogenization device at FGCZ. For detailed protocol please check:
- Tissue Homogenization Protocol
Single-Phase Polar Metabolites Extraction
- To extract polar metabolites from biofluids, tissue homogenate or adherent cells, organic solvents must added in specific ratios according to several protocols.
- Quenching ( i.e stopping metabolism) is essential at this step as some metabolites are completely interconverted in a few seconds.
- Single Phase Extraction Protocols
Liquid Chromatography
HILIC BEH Amide
- METHOD NAME: WpH9_fullMS_ddMS2
- Goal: Untargeted metabolomics of polar metabolites not retained on C18
- TESTED ON:
- IROA kit (7 plate_pooled samples)
- 150mix (in-house prepared mix of 50 pure compounds)
- Plasma (NIST) SRM 1950
- METABOLITE YEAST EXTRACT UNLABELED (ISO1-UNL, Cambridge Isotope Lab Inc.)
- Heart, Liver, Kidney, Adipose tissue, Mus musculus
- C. elegance total extract
- Myeloid cells, plasma, urine, Homo sapiens
LC Method
- LC Column: Waters Acquity BEH amide 150mm x 2.1µm x 1.7 µm
- Column Temperature: 40°C
- Flow Rate: 0.4ml/min
- Eluents:
- A: ACN 5% - ammonium bicarbonate 10 mM (pH 9)
- 200ml of A --> H2O 189ml+ 10mM NH4 bicarbonate (1ml of the 2M stock from -20°C), stir well, add ACN 10ml. Sonicate, check pH and adjust with Ammonium hydroxide if needed
- B: ACN 95% - ammonium bicarbonate 10 mM (pH 9)
- 400ml of B --> H2O 18ml, add 10mM NH4 bicarbonate (2ml of the 2M stock from -20°C), stir well, add ACN 380ml. Sonicate, check pH and adjust with Ammonium hydroxide if needed
- A: ACN 5% - ammonium bicarbonate 10 mM (pH 9)
- System equilibration and gradient:
- From 0ml/min to 0.1 ml/min and let it run from 5 min
- From 0.1ml/min to 0.2ml/min and let it run for 5 min
- From 0.2ml/min to 0.3ml/min and let it run for 5 min
- From 0.3ml/min to 0.4ml/min and let it run for at least 20 column volume (18.5 min) prior to starting acquisition
| Time (min) | Flow (ml/min) | % A | % B | Curve | |
| 1 | 0 | 0.4 | 1 | 99 | 5 |
| 2 | 0.1 | 0.4 | 1 | 99 | 5 |
| 3 | 6 | 0.4 | 70 | 30 | 5 |
| 4 | 7 | 0.4 | 70 | 30 | 5 |
| 5 | 7.5 | 0.4 | 1 | 99 | 5 |
| 6 | 12 | 0.4 | 1 | 99 | 5 |
- Injection volume: 3.5ul
- Needle Wash: 95% ACN
- Sample solvent: 90% ACN
- Autosampler Temperature: 5°C
- Sample vial/plates: Total recovery glass vials or 96 well plates
Mass Spectrometry
Ionization Parameters
- Polarity: HESI Negative
- In source CID 0.0eV
MS1 parameters
- Microscans: 1
- Resolution: 70,000
- AGC target: 1e6
- Maximum IT: 100 ms
- Number of scan ranges: 1
- Scan range: 70 to 1050 m/z
- Spectrum data type: Profile
MS2 parameters, dd-MS2
- Microscans: 1
- Resolution:17,500
- AGC target: 1e5
- Maximum IT: 50 ms
- Loop count: 5
- MSX count: 1
- TopN: 5
- Isolation window: 1.0 m/z
- Isolation offset: 0.0 m/z
- Scan range: 200 to 2000 m/z
- Fixed first mass: ―
- (N)CE / stepped (N)CE: 10, 20, 40
- Spectrum data type: Profile
Data Analysis
Skyline
Skyline is a freely available, open-source Windows client application for building Selected Reaction Monitoring (SRM) / Multiple Reaction Monitoring (MRM), Parallel Reaction Monitoring (PRM), DIA/SWATH and targeted DDA quantitative methods and analyzing the resulting mass spectrometer data.Within the untargeted metabolomics workflow, it is used to monitor the quality of the acquired data during the acquisition process. A predefined set of metabolites, present in our in-house developed standard mixture, are regularly monitored during the acquisition of a batch of samples, both in the above-mentioned mixture of standards and in QC samples, to gain insights on system performance.
TraceFinder
TraceFinder is the software in use for semi-targeted data analysis. When the interest is focused on specific subsets of metabolites or metabolic pathways, TraceFinder allows for tailored screening of all samples in a dataset, searching the metabolites of interest. The output is a list in which either the metabolite of interest is quantified (peak area) or reported as not detected in the datasets.Compound Discoverer
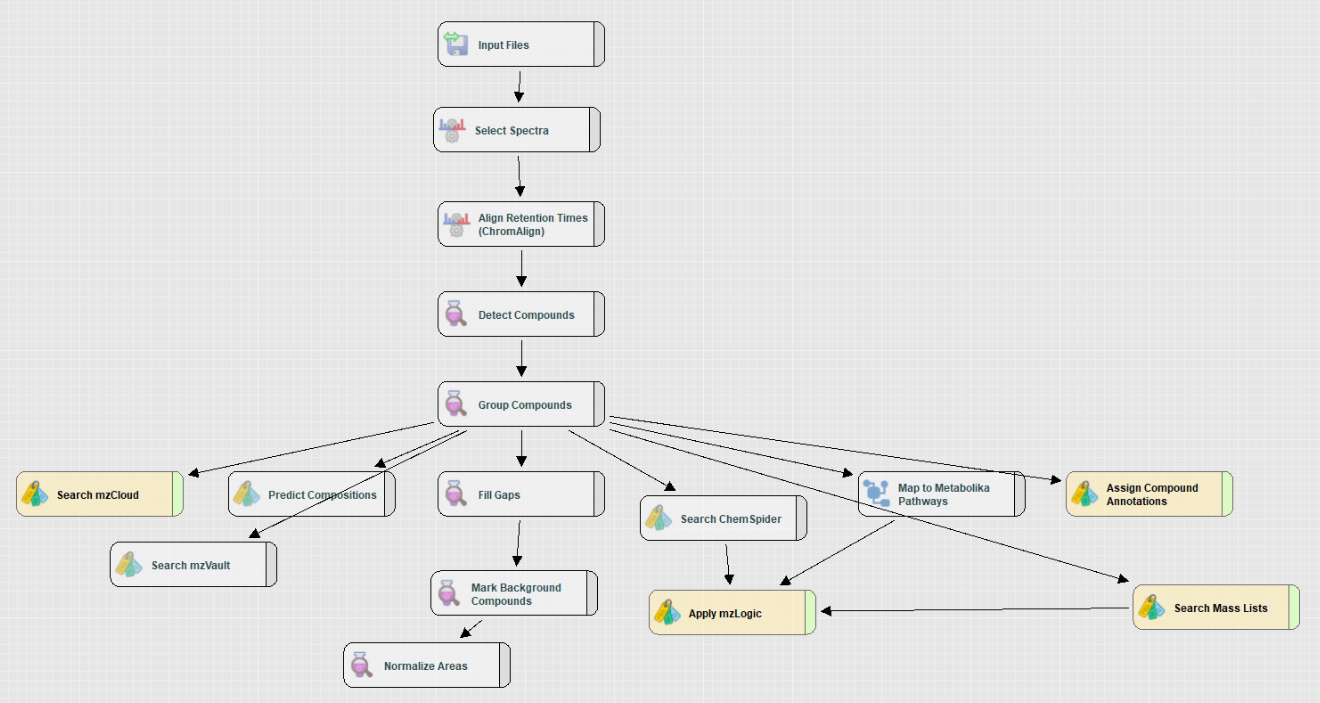
Compound Discoverer is the software in use for pure untargeted data analysis. When the project focus is group differences investigation and features discovery, Compound Discovery allows for dataset exploration in a modular and customizable fashion.The picture represents the Untargeted Metabolomics Workflow Tree generally used, each node comprises several parameters that can be manipulated depending on the dataset and the scope of the analysis.
Method Validation
Reproducibility of the gradient:
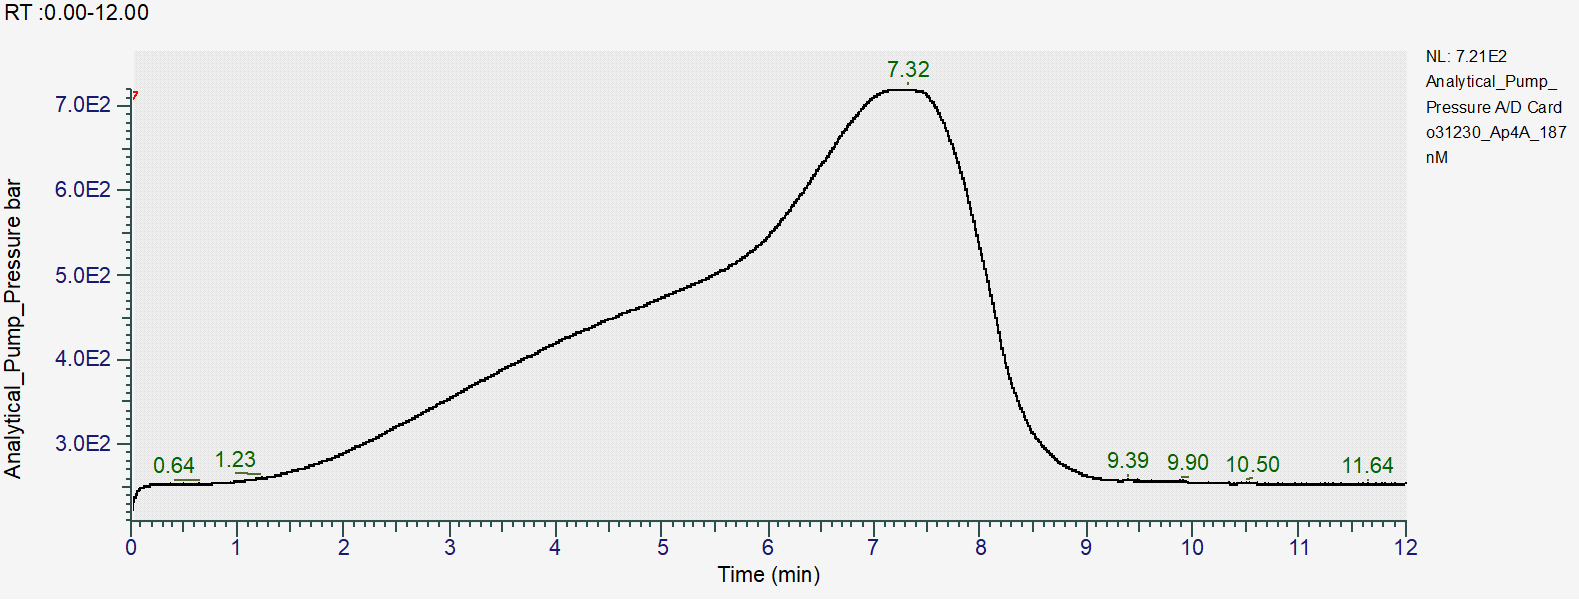
Chromatographic parameters
- Pressure at gradient start (99% B, 0.4ml/min): 250bar
- Max pressure over the gradient: 750bar
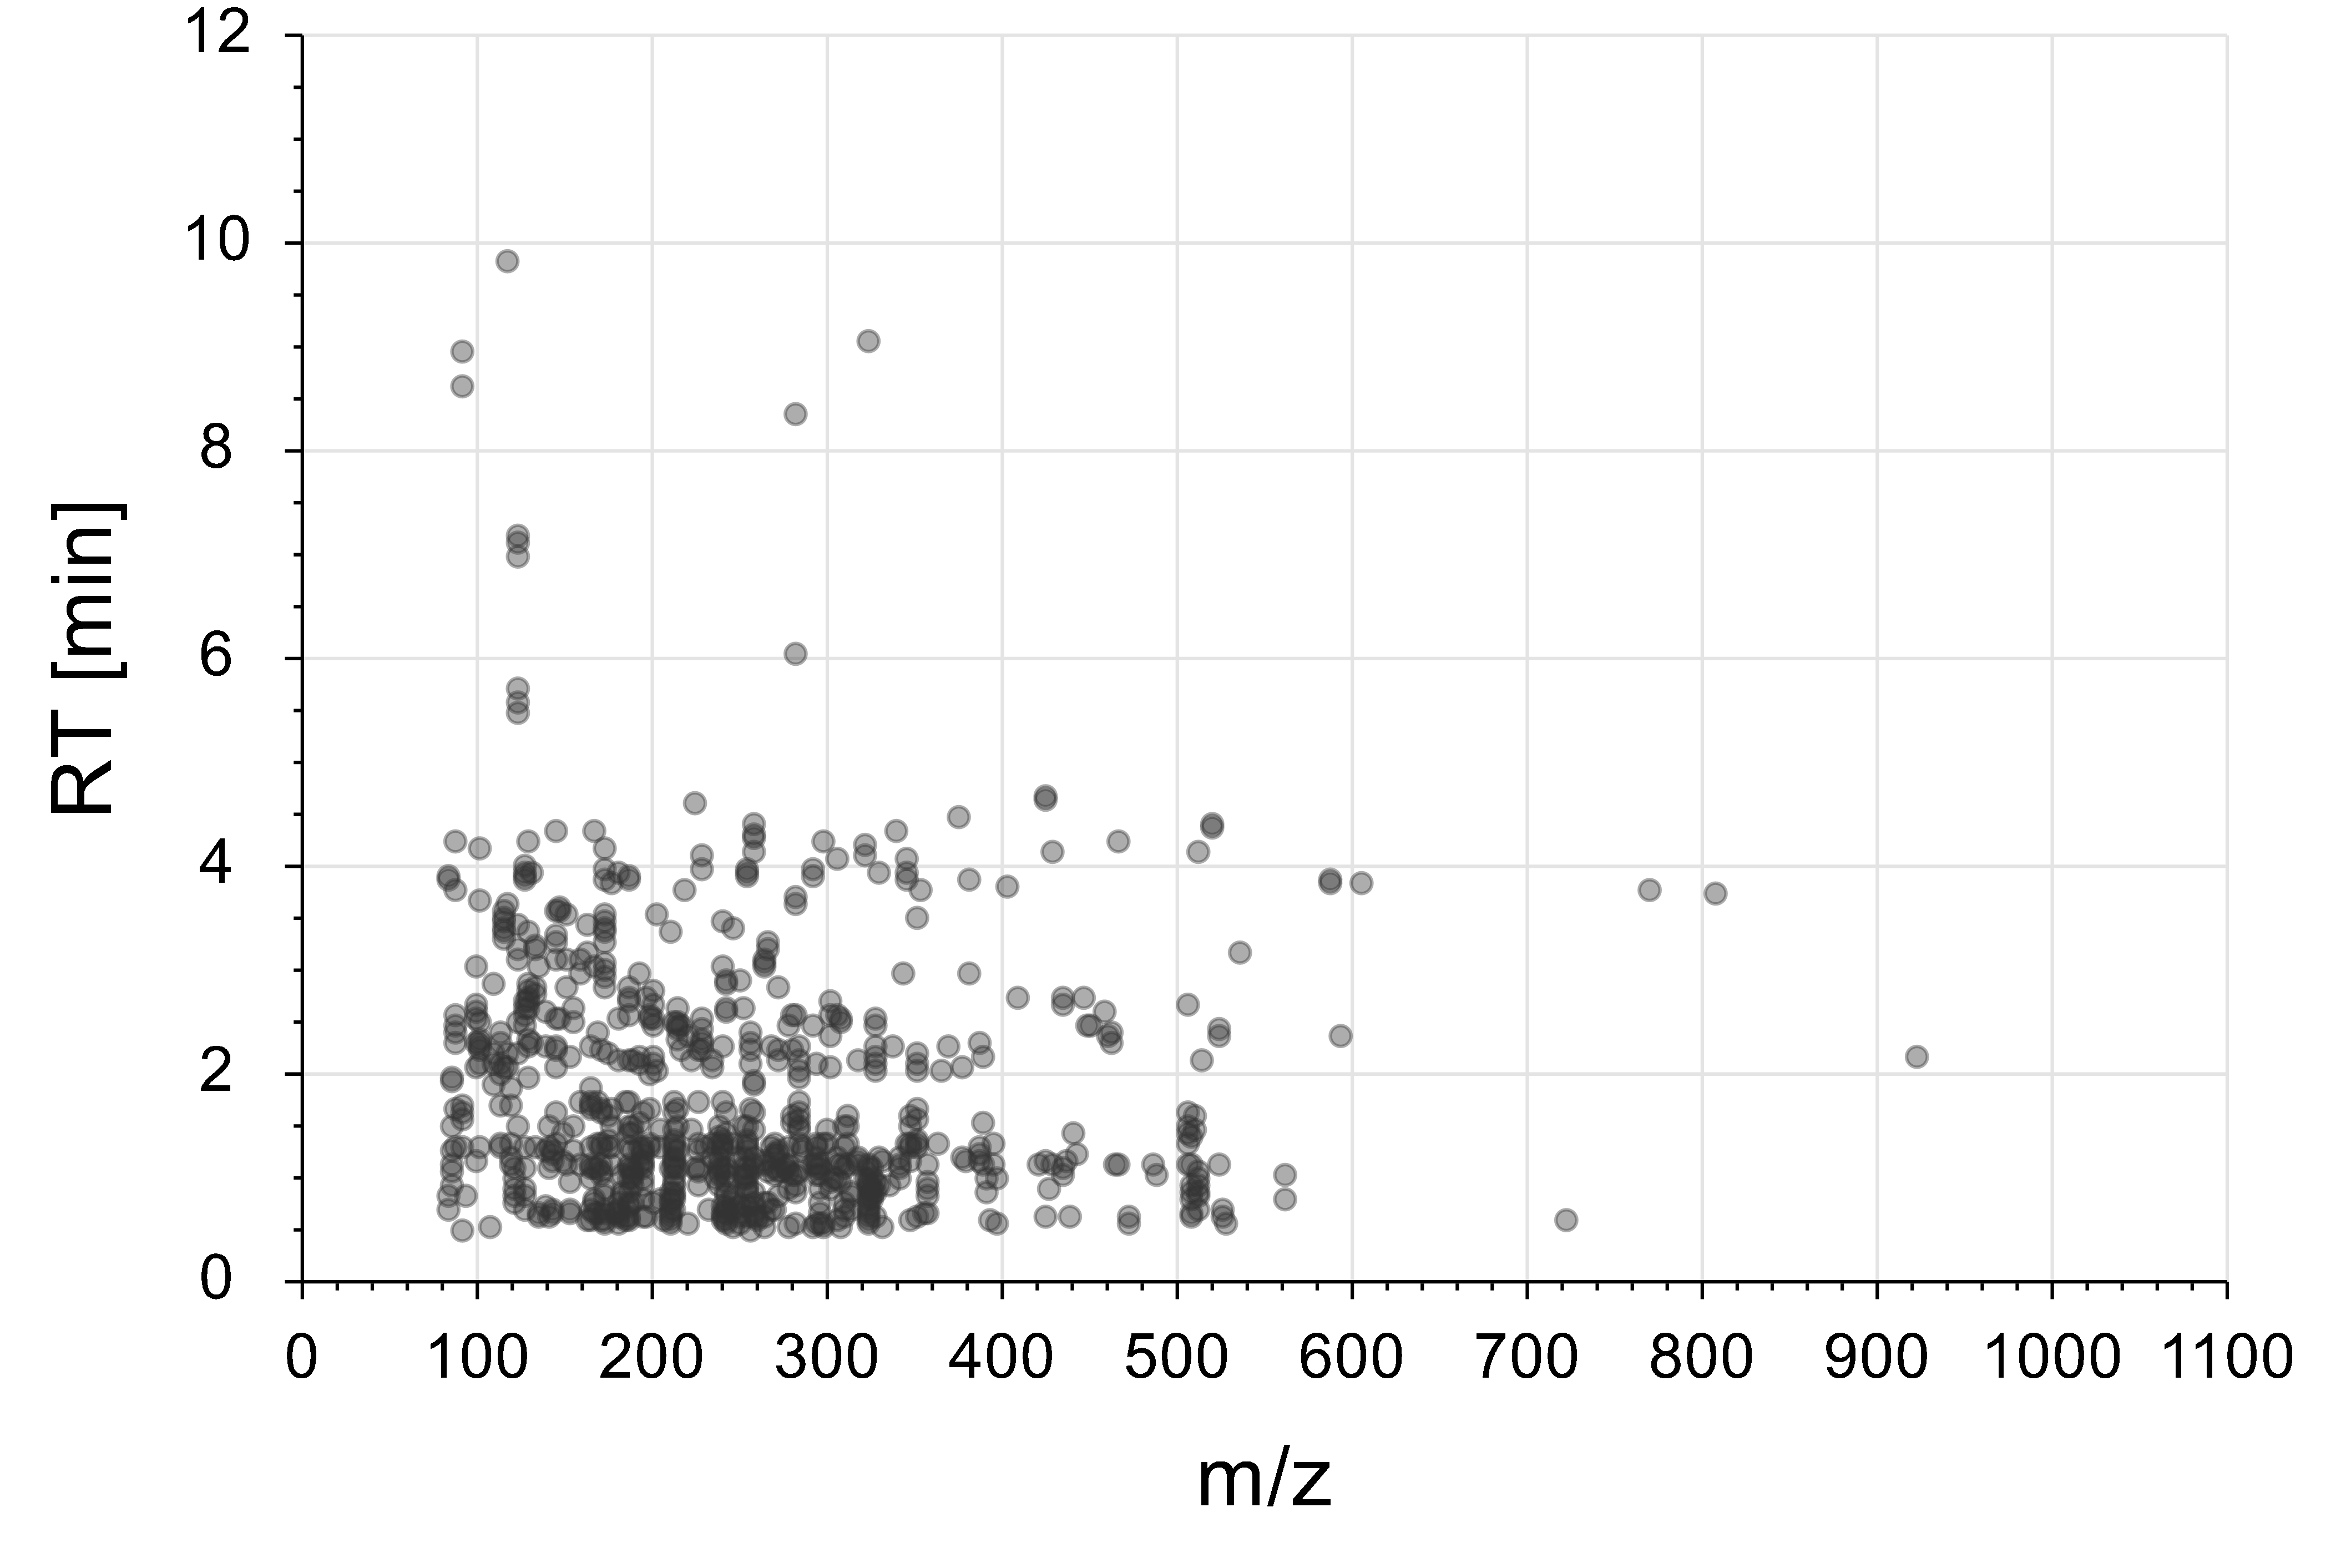
- m/z vs. RT map representing the IROA metabolite set detectable with the method
- RT reproducibility ( CV%) = 0.38%
- Peak area reproducibility (CV%) = 7.66%
- Quality of peak shape:
- Average Peak width ( right RT – left RT ) = 0.246min (14.7 sec)
- Average Peak symmetry factor( right RT- apex RT)/(apex RT – left RT) = 0.932
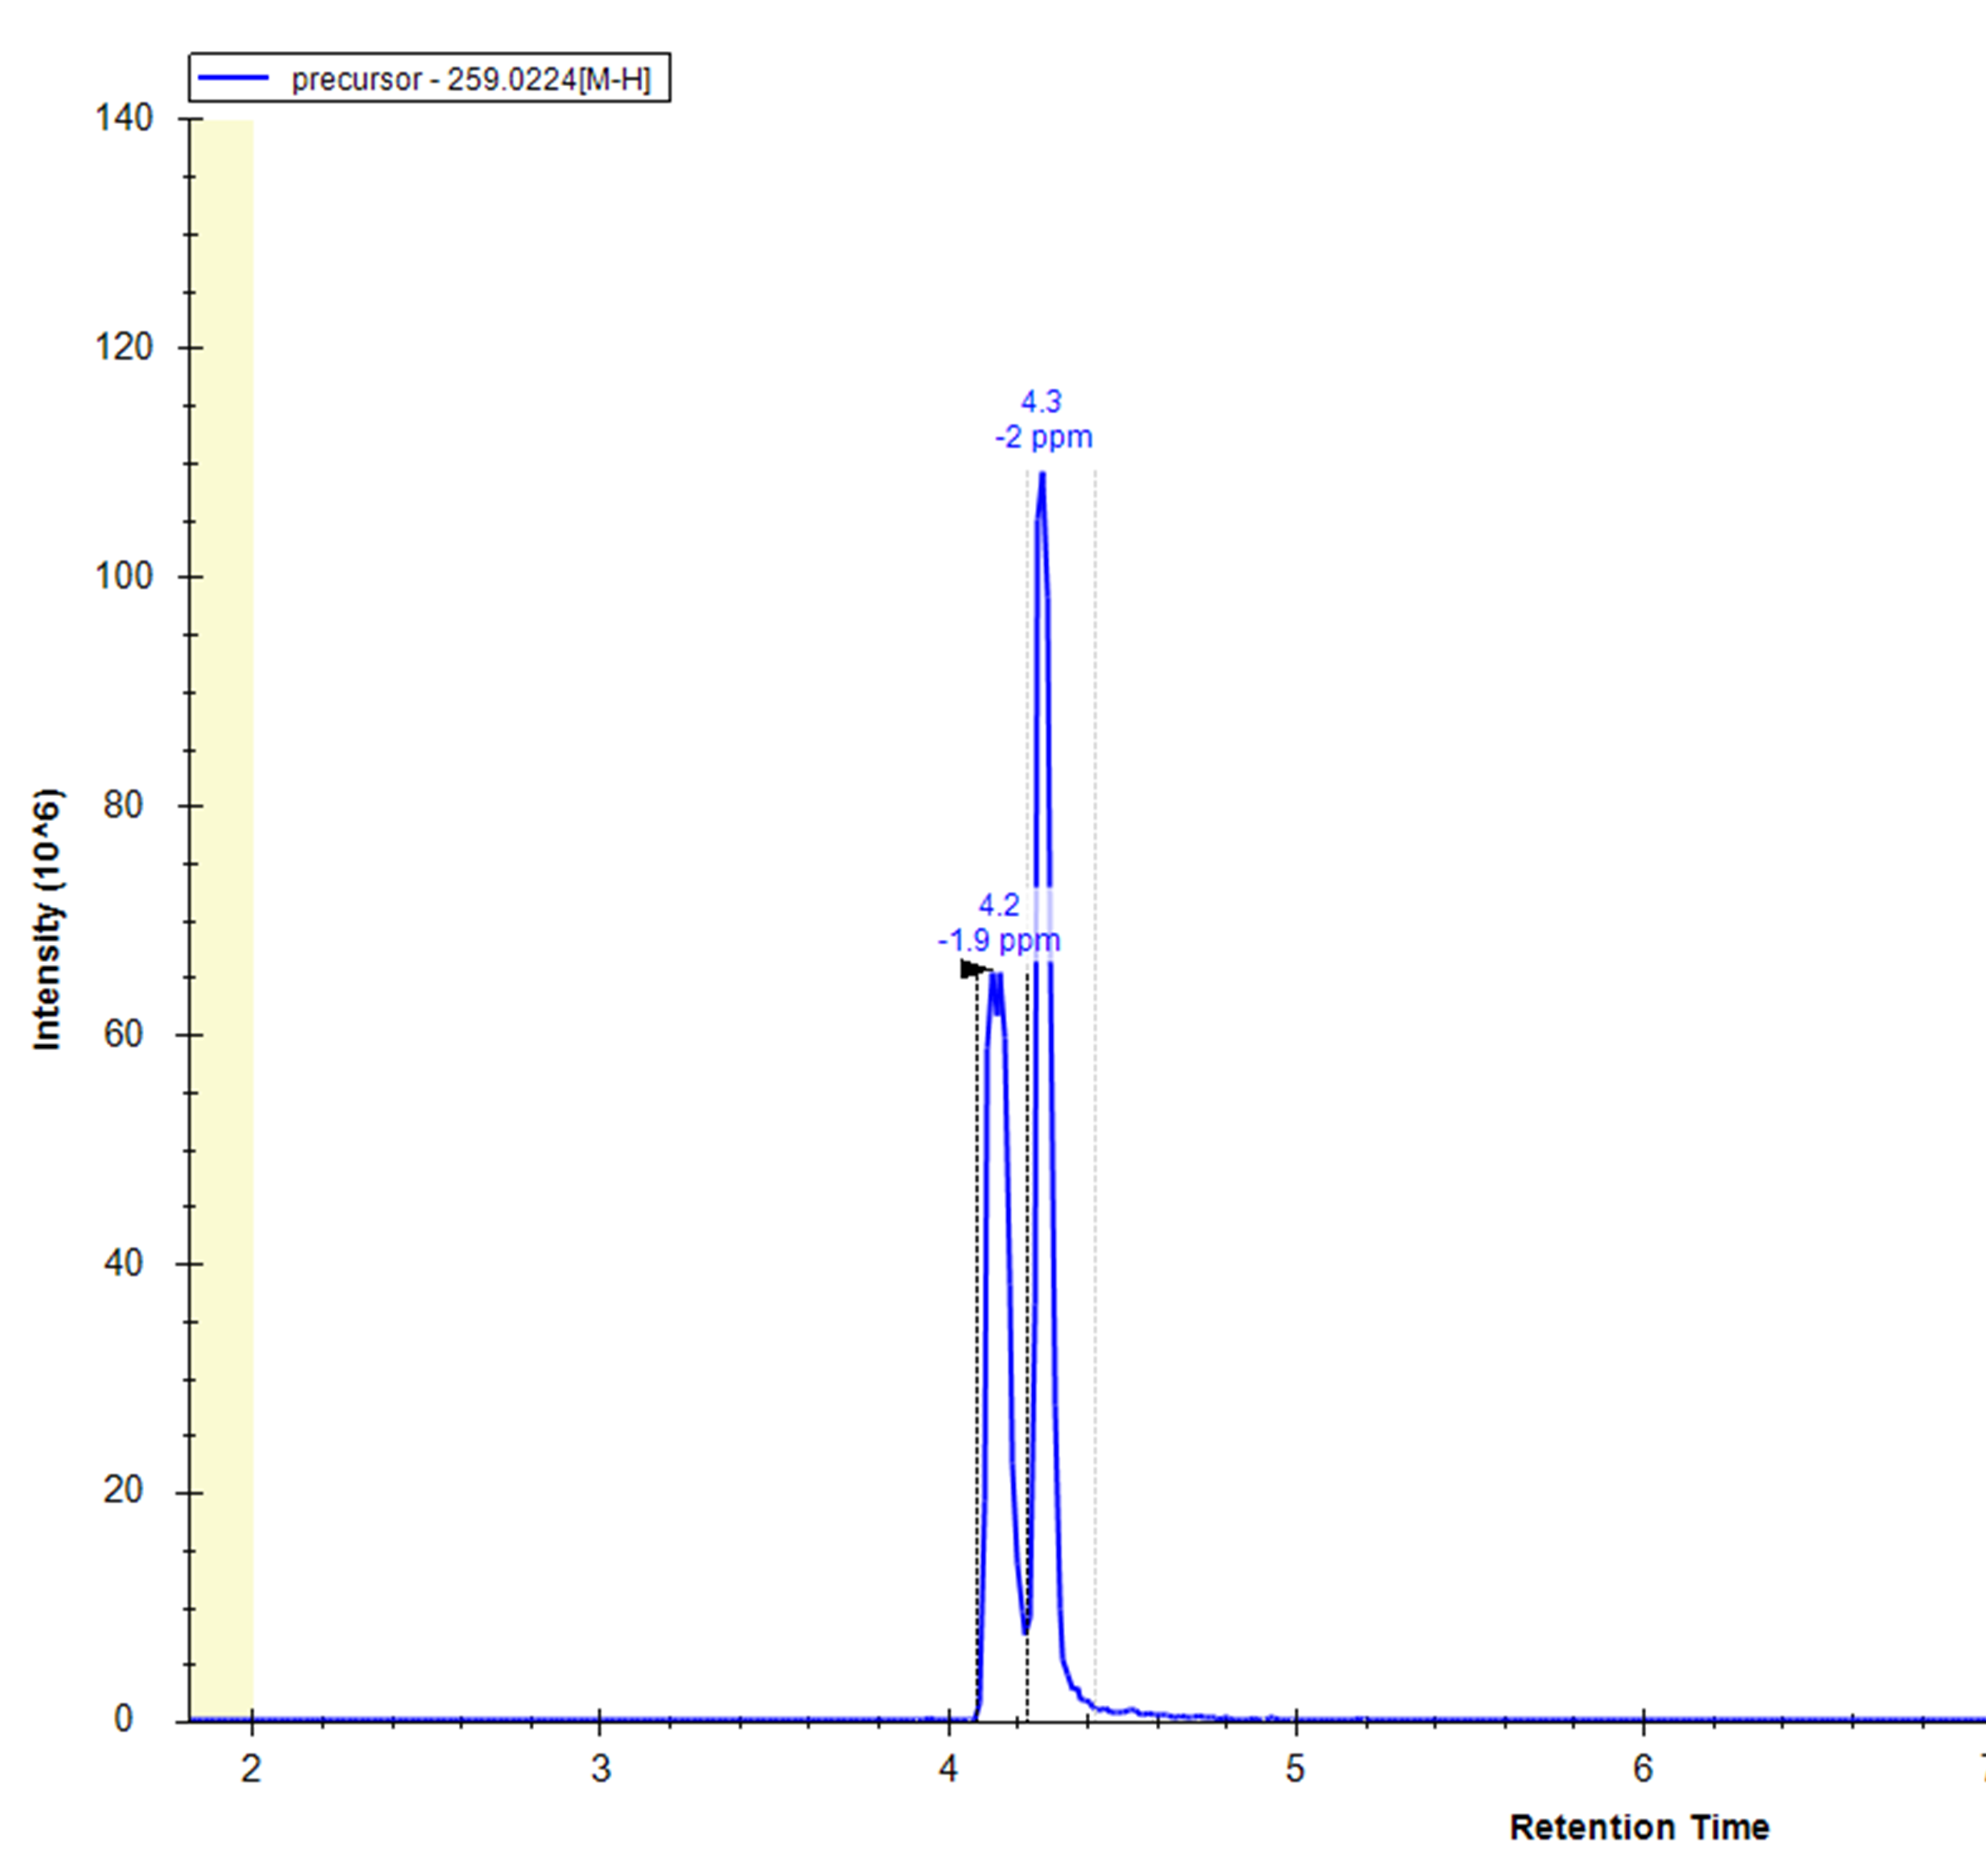
- Isomers separation: e.g. Frucose-6-P and Glucose-6-P
- Carryover:
- Average Carryover= 2.11% (Signal in 1st blank after highly concentrated sample/highly concentrated sample)
Method coverage
Of the 603 compounds in the IROA kit, 477 can be identified at MS1 level with the method, and 258 can be mapped on the KEGG metabolic map.