Proteomics > Which service should I request? > Proteome Identification and Quantification > Proteome Quantification - Label-Free
Depending on the experimental design and the biological question, we also offer Label-based proteome quantification methods.
For limited sample material, we have dedicated Low-input analysis protocols.
Depending on the type of your sample (e.g., supernatant, whole-cell lysate, biofluids) we observe some hundreds up to a few thousands of proteins. While the overall number of proteins can highly vary depending on the type of experiment, it is crucial that the number of proteins between your biological replicates is similar (reproducibility). This pilot step helps us determining this number of replicates necessary to detect the protein fold-change (effect size) that you expect see between two conditions, e.g. a reference and a treatment. In general, smaller biologically significant effect sizes require more samples to obtain a statistically significant result.
Four samples, corresponding to four biological replicates of your sample of interest, will be processed and measured in parallel. This is step is highly recommended!
The main LFQ experiment is performed following the protocol tested and optimized during the QC step. A minimum of 8 samples (4 samples, 2 categories) are processed and the protein quantification is performed. More biological replicates and more categories could be included in the experiment depending on the results of the sample size estimation.
Dozens of samples can be analyzed in as single experiment, or even 100s.
- Evosep, coupled to timsTOF Pro
- data acquisition using diaPASEF, with throughput between 30 and 200 SPDs (samples per day).
- data analysis using DIA-NN and prolfqua, as described above
Proteome Quantification - Label-Free (LFQ)
Table of contents
General description
Label-free proteomics quantification (LFQ) is an established approach to relatively quantify proteins on a large dataset in a rapid, reproducible, flexible, and affordable manner. Examples of applications are the identification of differentially regulated proteins and pathways in conditions such as:- Treatment(s) vs Control
- Disease vs Healthy
- KO vs WT
- Time series
- ...and more
Depending on the experimental design and the biological question, we also offer Label-based proteome quantification methods.
For limited sample material, we have dedicated Low-input analysis protocols.
Workflow
Our default workflow for label-free proteome quantification consists of 3 steps.
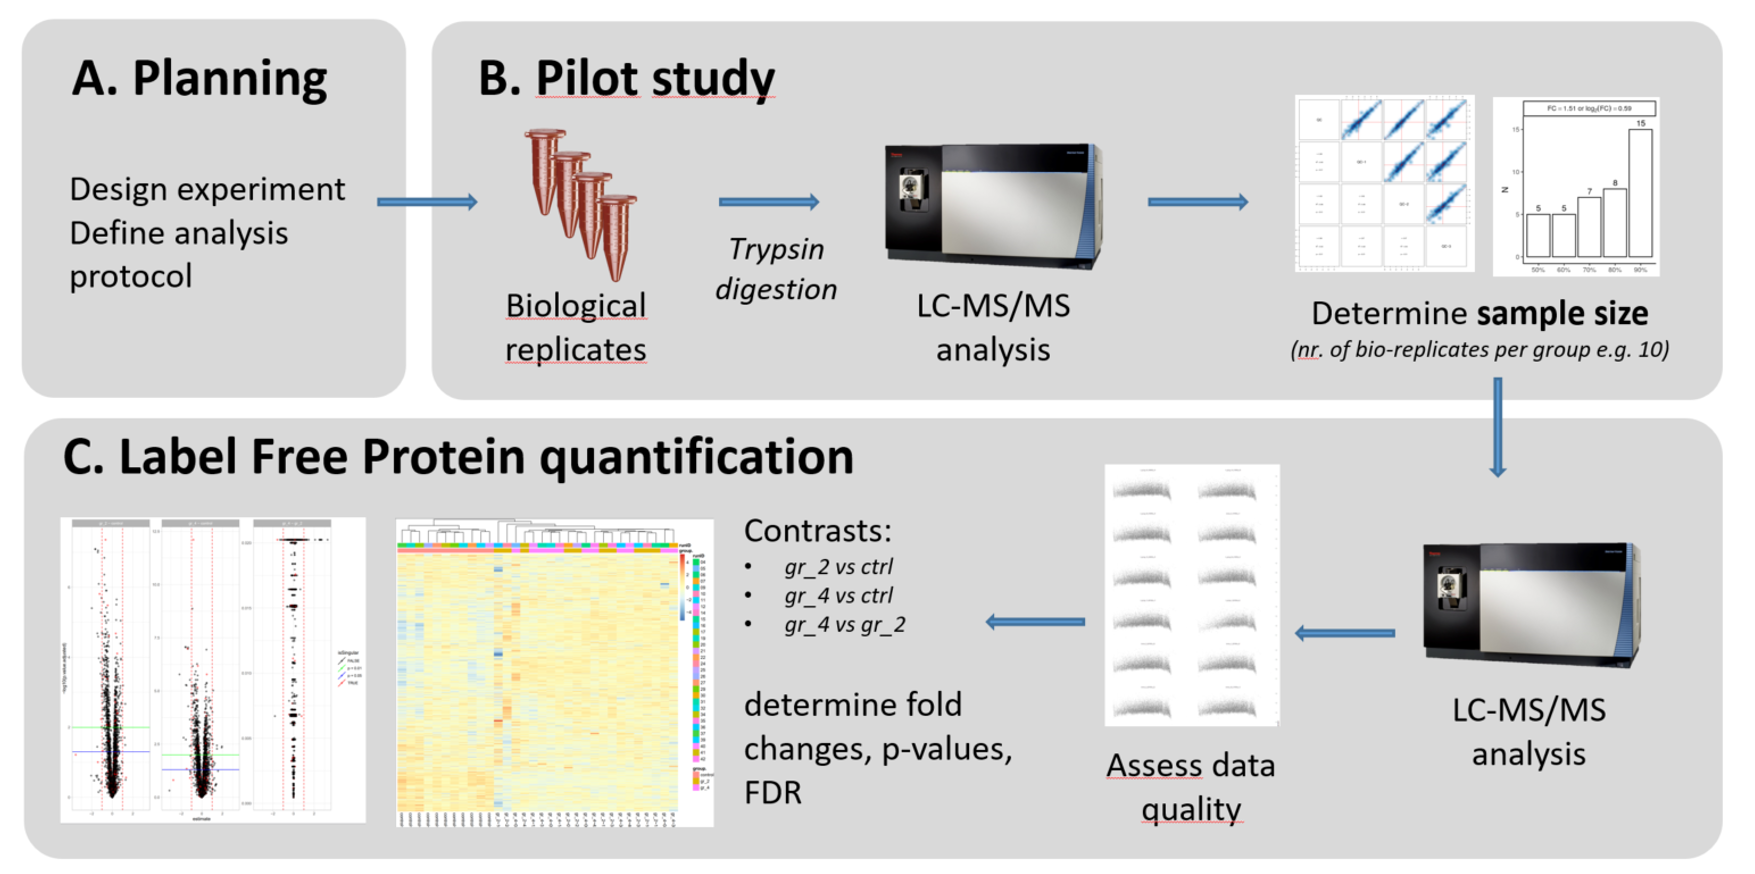
A. Planning
As a first step, we need to clarify the goal of the project and clarify the analytic and bioinformatics strategy. A proper experimental design will be defined together with FGCZ staff. Please contact us at proteomics at fgcz.ethz.ch for a meeting, or directly contact your coach If you already have a B-Fabric project at FGCZ.B. Pilot (QC) step
Goal:- Test the feasibility of the experimental procedure (protocol, starting amount, quality of the samples, ...)
- estimate the sample's size
Depending on the type of your sample (e.g., supernatant, whole-cell lysate, biofluids) we observe some hundreds up to a few thousands of proteins. While the overall number of proteins can highly vary depending on the type of experiment, it is crucial that the number of proteins between your biological replicates is similar (reproducibility). This pilot step helps us determining this number of replicates necessary to detect the protein fold-change (effect size) that you expect see between two conditions, e.g. a reference and a treatment. In general, smaller biologically significant effect sizes require more samples to obtain a statistically significant result.
Four samples, corresponding to four biological replicates of your sample of interest, will be processed and measured in parallel. This is step is highly recommended!
C. Label Free Quantification step (LFQ)
The main LFQ experiment is performed following the protocol tested and optimized during the QC step. A minimum of 8 samples (4 samples, 2 categories) are processed and the protein quantification is performed. More biological replicates and more categories could be included in the experiment depending on the results of the sample size estimation.
Dozens of samples can be analyzed in as single experiment, or even 100s.
Requirements and considerations
- The first QC step is highly recommended. Do not prepare the samples for the main LFQ until these results are available.
- Ideal protein amount: 25-50 µg (minimum 1 µg).
- Lower amounts are possible (see Low-input analysis)
- Protein extraction from tissues, cells or biofluids is offered in selected cases
- Replicates: 4+ for in-vitro experiments, 5/10+ for animal/human experiments (depending on the results of the sample size estimation)
- Buffer composition: every experiment requires some optimization, please contact us at proteomics at fgcz.ethz.ch
- Turnaround time
- QC (Pilot) step: ~1 week
- Main label-free quantification experiment (2-4 weeks)
Protein digestion
- Protein digestion is most commonly done using an SP3-based method
- Alternative digestion protocols can be used, such as PreOmics iST, in-solution or on-beads digestion, (FASP, TCA precipitation, or PCT)
Data acquisition and data analysis
The data can be acquired and analysed in multiple ways, but these are the 2 most common strategies used at FGCZ:1. Data-Independent Acquisition (DIA) mode
The standard method for LFQ analyses, and ideal for large datasets, clinical samples and for peptide-centric quantification- data acquisition on M-Class + Orbitrap Fusion Lumos or Orbitrap Exploris 480 (or similar generation, see here using commercial trap and analytical columns
- DIA mode, with randomized data acquisition (incl. 4-5 samples in DDA mode)
- iRT peptides spiked in the samples
- QC sample every 4-5 runs
- Protein identification and quantification using DIA-NN or Spectronaut (quantification at the MS2 level)
- Data analysis using linear or mixed statistical models, using our published prolfqua package.
- Generation of reports, tables and plots
- NEW (Oct. 2023): visualization of data in exploreDEG Interactive Shiny App!
- (for selected species, e.g. human and mouse, Gene Set Enrichment Analysis (GSEA) and Over-Representation Analysis (ORA) are performed using our fgcz.gsea.ora package, which integrates WebGestalt. See FGCZ-GSEA-ORA Poster
2. Data-Dependent Acquisition (DDA) mode
Used only for some LFQ experiments.- data acquisition on M-Class + Orbitrap Fusion Lumos or Orbitrap Exploris 480 (or similar generation, see here using commercial trap and analytical columns
- DDA mode, with randomized data acquisition
- iRT peptides spiked in the samples
- QC sample every 4-5 runs
- Protein identification and quantification using FragPipe or MaxQuant (quantification at the MS1 level)
- Data analysis using linear or mixed statistical models, using our published prolfqua package.
- Generation of reports, tables and plots
- NEW (Oct. 2023): visualization of data in exploreDEG Interactive Shiny App!
- (for selected species, e.g. human and mouse, Gene Set Enrichment Analysis (GSEA) and Over-Representation Analysis (ORA) are performed using our fgcz.gsea.ora package, which integrates WebGestalt)
Large batches and low-input proteomics
Large batches (100(s) of samples)
For projects requiring the analysis of 100s of samples, the most common LC-MS setup is:- Evosep, coupled to timsTOF Pro
- data acquisition using diaPASEF, with throughput between 30 and 200 SPDs (samples per day).
- data analysis using DIA-NN and prolfqua, as described above
Low-input proteomics (10s-100s of cells)
For projects with very limited starting material, see our dedicated Low-input analysis pageAssessment of the LC-MS performances
The performances of the LC-MS instruments are constantly monitored using 3 different pipelines (PanoramaWeb; QCloud; internal FGCZ tool(s)), and 2 sets of standards:- autoQC4L:
- 25 ng of digested proteins from K652 cells + 6x5 LCMSMS Peptide Reference Mix (Promega)
- at the start and end of a queue, to assess identification and quantification rates (see QC4L poster)
- autoQC01:
- 10 peptides from commercial digested BSA (25 fmol) and 11 iRT peptides
- PRM acquisition - acquired every 4-6 samples to monitor potential drops in sensitivity.